Investment performance
Investment Activity (/assets/investment) describes money added to investments.
Investment Performance (/assets/gain) describes the economic return those
investments produced. Portfolio Analysis (/assets/analysis) describes what you own.
Use Investment Performance when you want to separate growth caused by market returns from growth caused by new contributions.
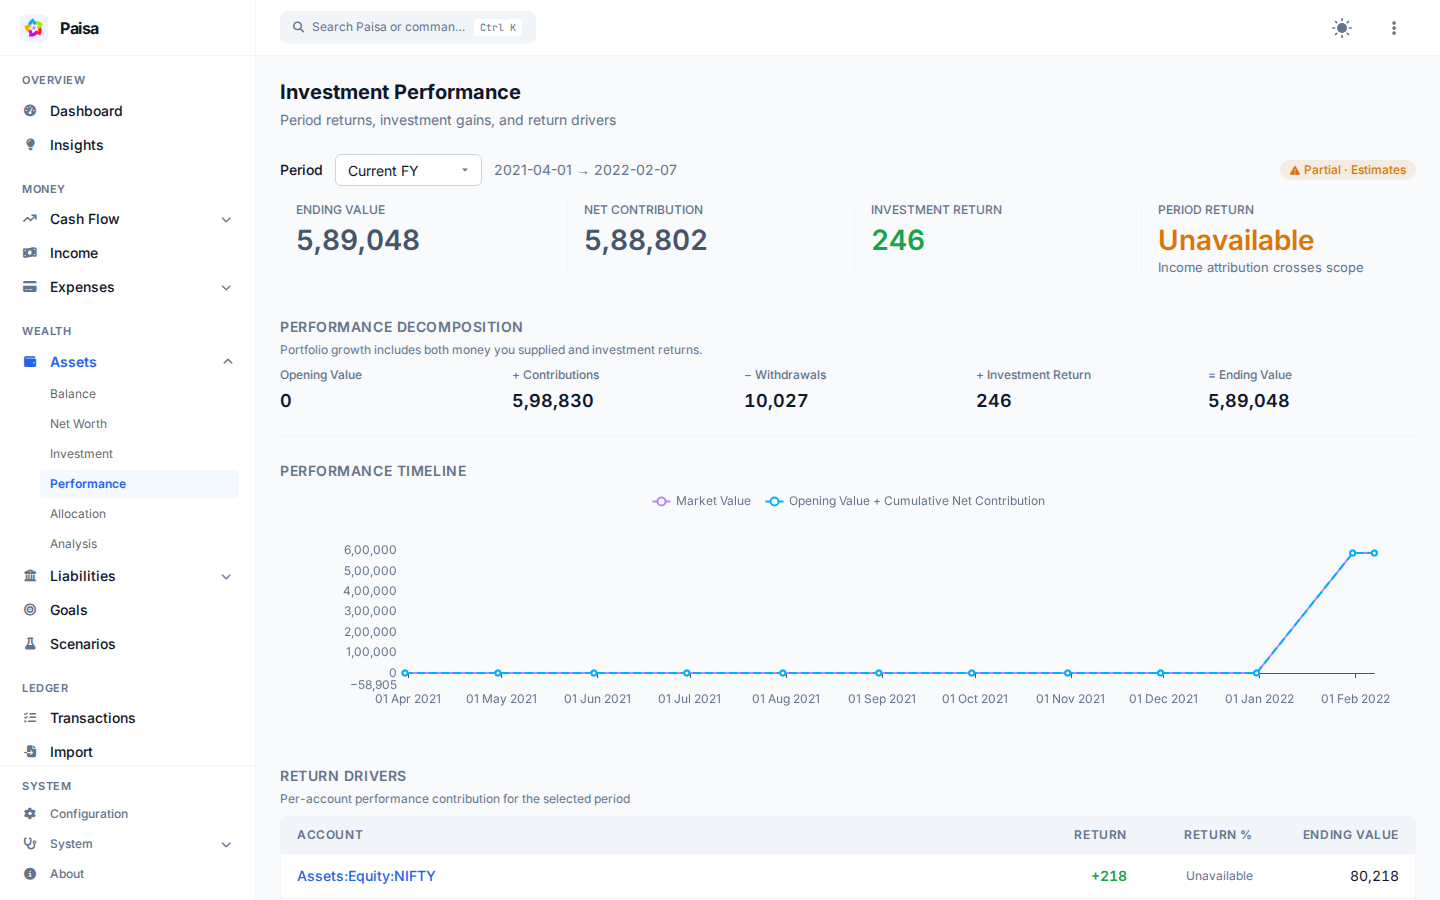
Select Current FY, Previous FY, 1 Year, or Since Inception. The URL preserves the
selection, including when you open an account. Explicit from and to dates are
inclusive. Current FY follows your configured financial-year start. One Year ends
today and starts the day after the prior-year anniversary; February 29 anniversaries
are clamped to February 28 before adding one day.
Growth versus return
Suppose investments opened at ₹10,00,000, you contributed ₹3,50,000, and they closed at ₹14,00,000. Portfolio growth was ₹4,00,000, but investment return was ₹50,000:
Opening Value             ₹10,00,000
+ Contributions            ₹3,50,000
− Withdrawals                     ₹0
+ Investment Return          ₹50,000
= Ending Value            ₹14,00,000
A falling portfolio balance can still have positive investment return if you withdrew money. The timeline compares market value with opening value plus cumulative net contributions. The difference is investment return since the selected period began. It samples opening, month-end, and closing boundaries.
What counts as an investment flow
The investment universe contains asset accounts other than Assets:Checking and
its descendants. Forecast and future entries are excluded. Selecting an account
includes its exact name and colon-delimited descendants. Transfers inside that
selection cancel; transfers across its boundary are contributions or withdrawals.
Shared transaction classification supplies both cumulative Gain and period performance. Period investment return equals the difference in cumulative gain between the closing and opening valuations. Opening valuation is immediately before the first day; closing valuation includes the final day.
Capital gains follow the existing Income:CapitalGains:{asset suffix} convention.
Return includes realized and unrealized gain. Stock splits change units without
creating capital flows. Supported interest credits are return, not contributions.
Dividend income under Income:Dividend and descendants is allocated across
same-direction asset postings within its transaction, proportionally and capped
at the asset flow. Mixed transactions retain their external contribution and
reversals reverse their dividend allocation. This corrects previous lifetime
Gain/Networth figures that counted reinvested dividends as new investments.
For distributed income, record the income in the investment account and then transfer it to checking, as in the existing interest documentation. Direct income to checking without transaction evidence identifying an investment account is flagged as potentially incomplete. Account ownership is never guessed from an income-account suffix.
Exact-account return amounts reconcile to the portfolio's return. Account return percentages are not additive. A reconciliation failure is an error, never an invented balancing account.
Period return and XIRR
Period Return uses Modified Dietz, without annualization:
weighted capital = opening value + sum(weight × signed flow)
period return = investment return / weighted capital
Contributions are positive flows; withdrawals are negative. Each flow's weight is the calendar days after its date through the end, divided by inclusive period days. Flows occur at end of day: day 15 of 30 has weight 0.5; the last day has weight zero. A ₹50,000 mid-period contribution, ₹1,00,000 opening value, and ₹10,000 return therefore produce an 8% period return.
A denominator at most 0.01 reporting-currency units, or at most 1e-8 times opening absolute value plus absolute transaction flows, makes the percentage unavailable. Amounts can remain complete. An unavailable return is shown as a dash, not 0%.
Since-inception XIRR retains Paisa's existing annualized money-weighted algorithm, through today, independently of the selected historical period. Existing XIRR endpoints retain percentage points. The new performance API represents both return fields as ratios: 0.1234 means 12.34%.
Data quality
Complete amounts and an available percentage are separate concepts. Open holdings that require trade-price or cost fallback at either endpoint make amounts partial and suppress Period Return. Zero holdings require no quote. Market quotes use the existing on-or-before rule; their source dates are disclosed without assuming an arbitrary freshness threshold. An estimated intermediate chart point does not invalidate a percentage calculated from reliable endpoints.
The Dashboard's Current FY summary uses the same calculation. API clients can
request /api/investment/performance with preset, or from and to, plus
optional accountPrefix, timeline=true, and drivers=true parameters.
This feature provides historical facts, not benchmarks, forecasting, investment advice, trading, AI, or scenario planning.